CLEANING
Pre-summer robotic cleaning
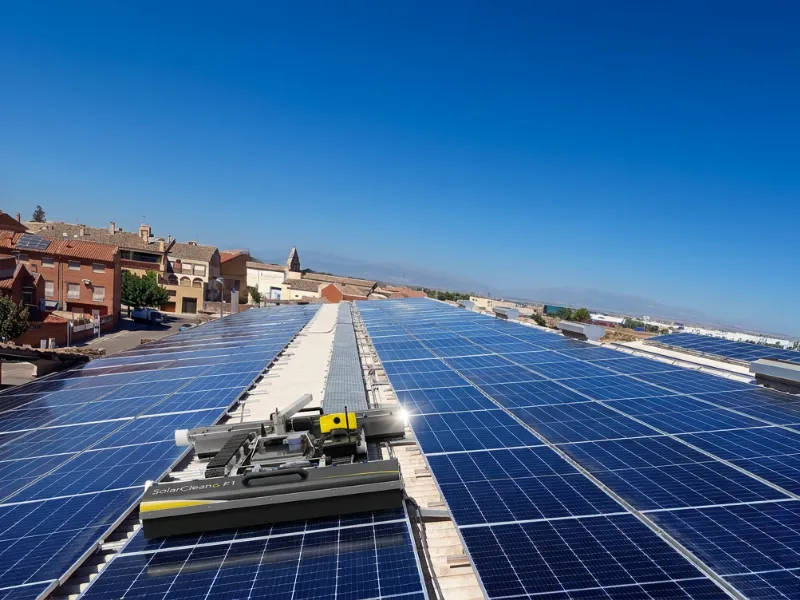
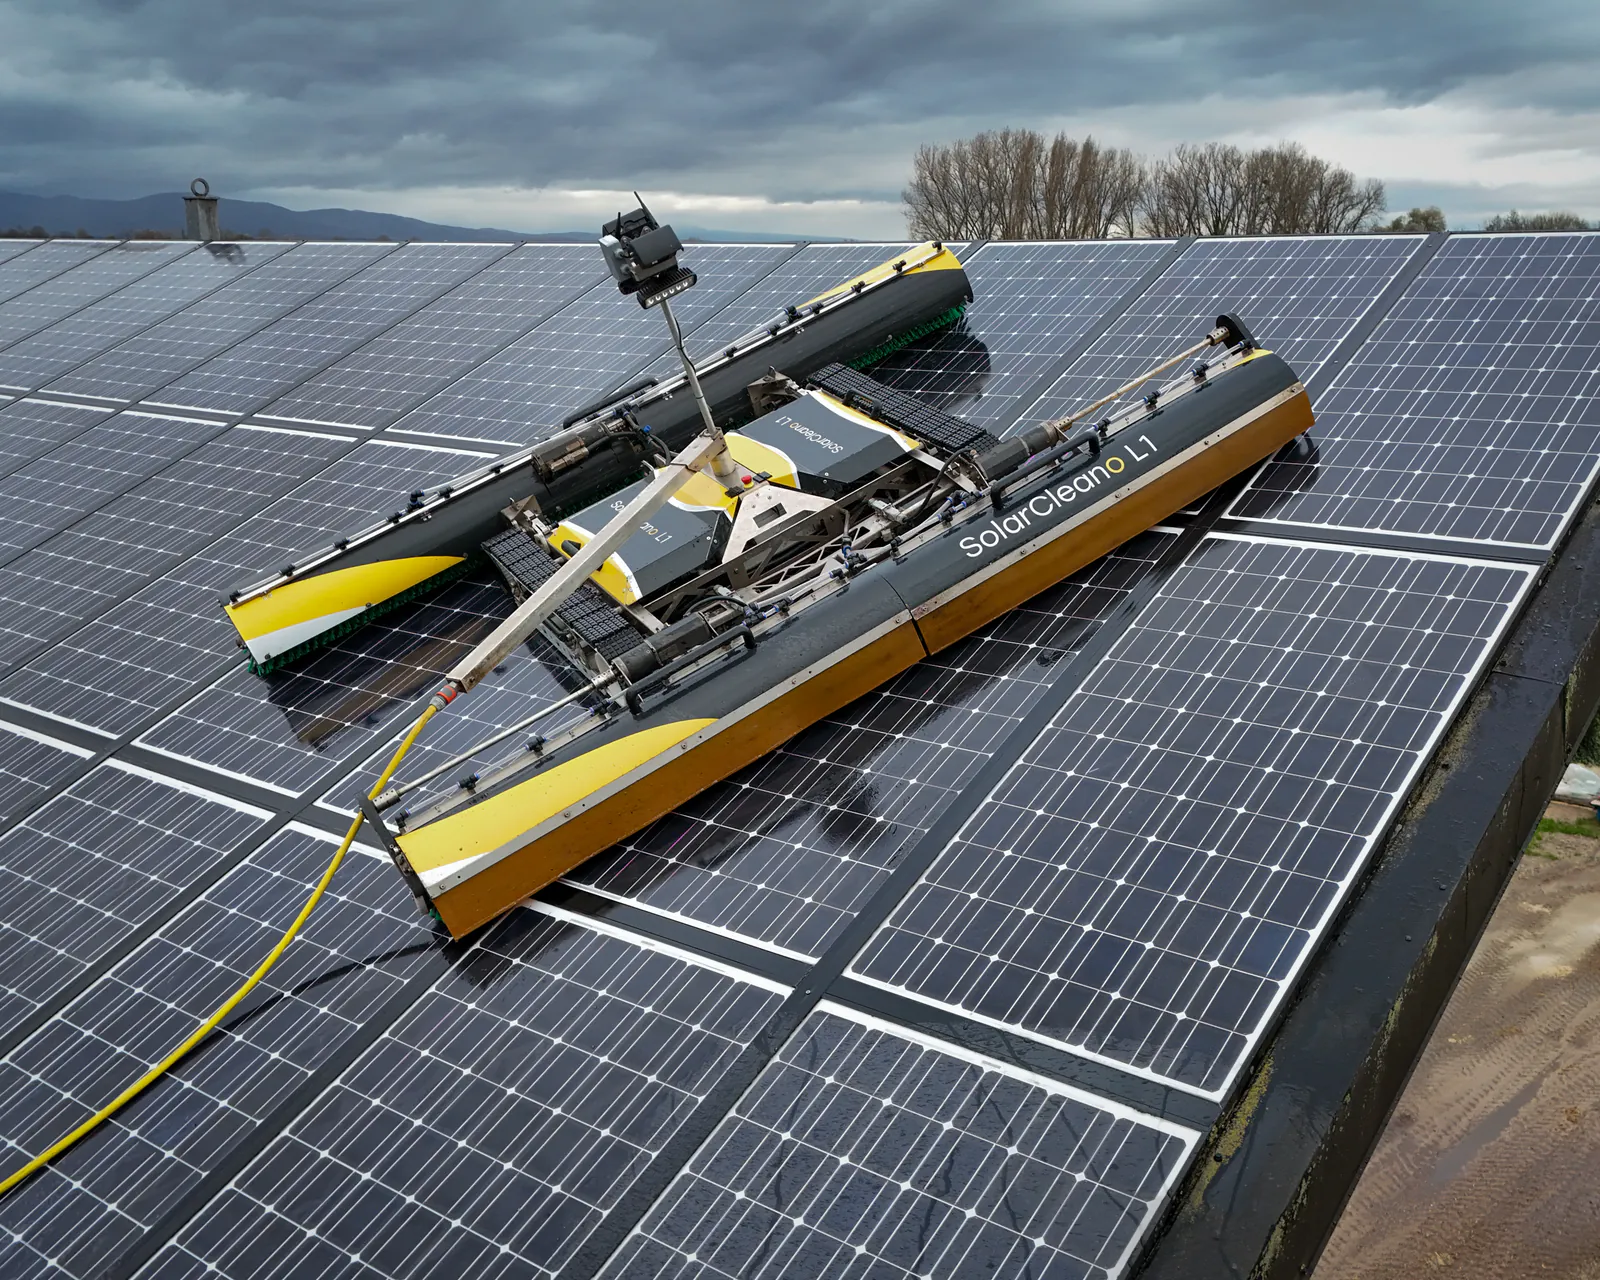
SolarCleano robots and pure demineralized RO water right before peak summer irradiation.
Input your plant parameters to evaluate the annual energy and revenue lost to soiling, and discover how many cleanings per year deliver optimal net ROI.
Engineering estimate based on regional solar irradiance and mathematical separation between loose dust (partially washed by rain) and cemented deposits (removable only via mechanical technical washing). The algorithm proposes the frequency maximizing net return on investment (minimum mobilization €1,500 with tiered multi-visit discounts).
Total DC capacity combined with historical irradiance data for your specific province or district.
Calibrated to industrial airborne particulate sources and panel tilt angles.
Soiling compounds during dry summer months; rainfall only strips loose particulates.
Quantified by multiplying recoverable lost MWh by your current energy feed-in rate.
Final quotation accounts for site logistics, crane access, and water hookups, delivered in 24 hours.
SolarCleano robots and pure demineralized RO water right before peak summer irradiation.
Lock in your optimal schedule to prevent long-term glass degradation and hot-spots.
Pinpoint strings underperforming due to heavy soiling, bypass diodes, or micro-cracks.
It provides a robust engineering estimate based on regional irradiation databases and empirical derating factors. Exact loss measurement requires on-site IV curve tracing, radiometric thermography, or comparing SCADA production before and after a cleaning visit.
From validated PVGIS and meteorological databases covering all provinces of Spain and districts of Portugal.
To automatically generate and deliver your monthly degradation breakdown PDF. We respect your inbox and never send unsolicited spam.
The mathematical model works on any scale. Clean Sunny's operational deployment begins at 1,000 modules (utility-scale and commercial rooftops).
Yes. We maintain dedicated bases in Porto, Barcelona, Madrid, and Seville, operating across the entire Iberian Peninsula.
Share your module count and site location. A project manager will deliver an itemized proposal within 24 hours.
Phone +34 936 555 555 · WhatsApp +34 623 984 040