No functional abnormality
Module operates within expected thermal thresholds. Monitored during the next annual pass.

We fly your PV plant with high-resolution radiometric thermal cameras and examine every module image-by-image. You receive a standard-compliant engineering report, an interactive browser viewer, and CSV data with all anomalies classified by severity.
Quotation within 24 hours · The solar plant continues generating during flight
Licensed UAS commercial operator certified for open and specific categories (standard STS-01 and STS-02 scenarios) with comprehensive civil liability coverage.
We structure findings into three actionable categories according to recommended intervention and Class of Abnormality (CoA).
Thermography pinpoints thermal signatures and quantitative severity. For balance-of-system electrical anomalies, the root cause is validated on-site by field technicians.
Confirmed via visual RGB comparison.
Hotspots, typically along the lower edge of the module. Clean
Localized hotspots directly over visible deposits. Clean
Industrial fallout, scale, or lichen not removed by rain. Specialized washing
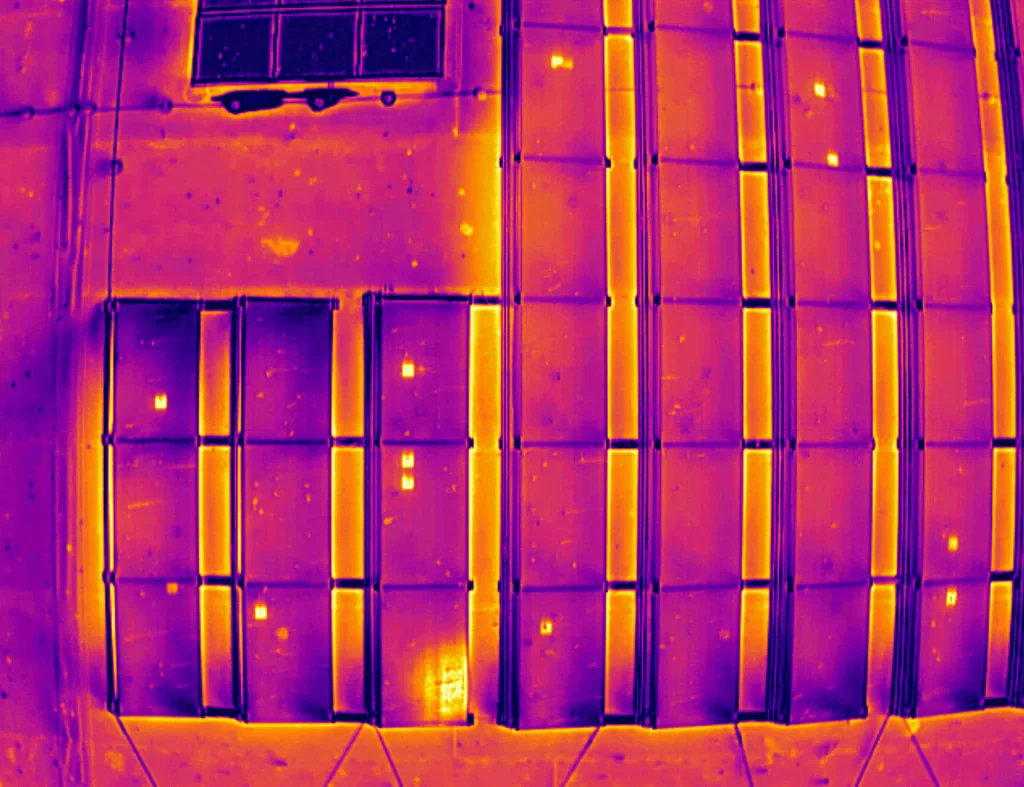 Térmica
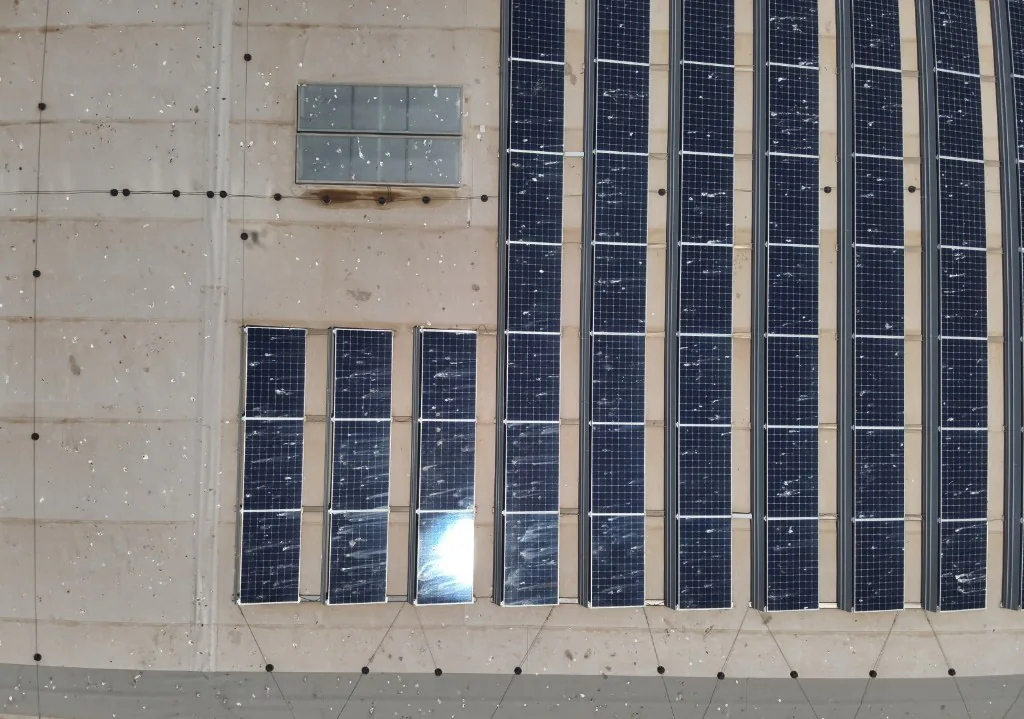 Visible
Overheating matching weed shading profiles. Vegetation control
From structural elements, adjacent rows, wires, or temporary scaffolding. Monitoring
Present on module during the flight pass. Logged in report
No external visible cause detected.
Caused by micro-cracks, internal manufacturing defects, or lower-yield cell. Confirmed by electroluminescence.
Typically indicative of cell micro-cracking and moisture ingress.
Layer separation, bubbling, or backsheet degradation.
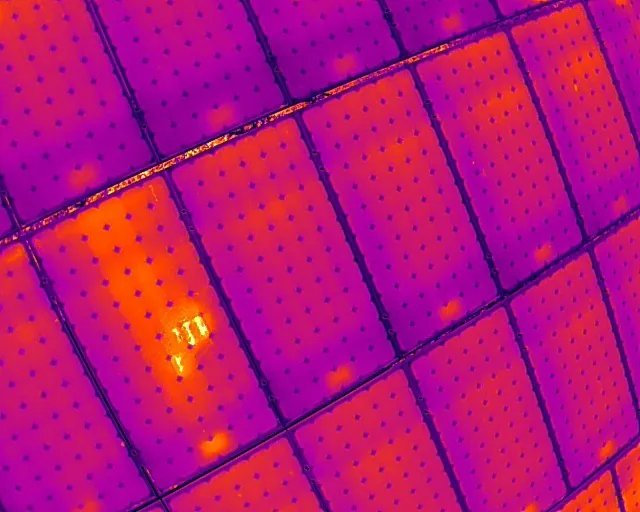 Térmica
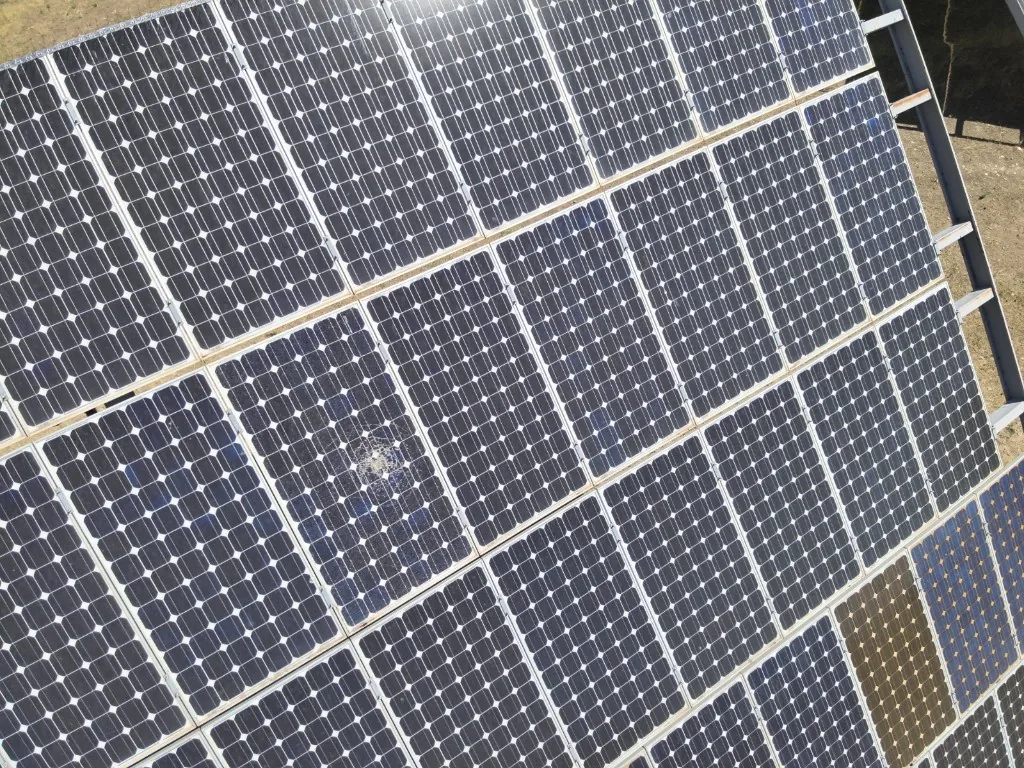 Visible
Always classified as CoA 3 due to electrical and fire hazards.
Linear thermal anomaly from bad solder joints, ribbon fatigue, or corrosion.
Always requires technician verification on-site.
1/3 or 2/3 of module: activated or damaged bypass diode, ribbon disconnection, or junction box fault.
Likely short-circuited diode.
Blown fuse, disconnected MC4 lead, open isolator, insulation fault, or junction box defect.
String fuse blown, DC cabling damaged, combiner box failure, or inverter section down.
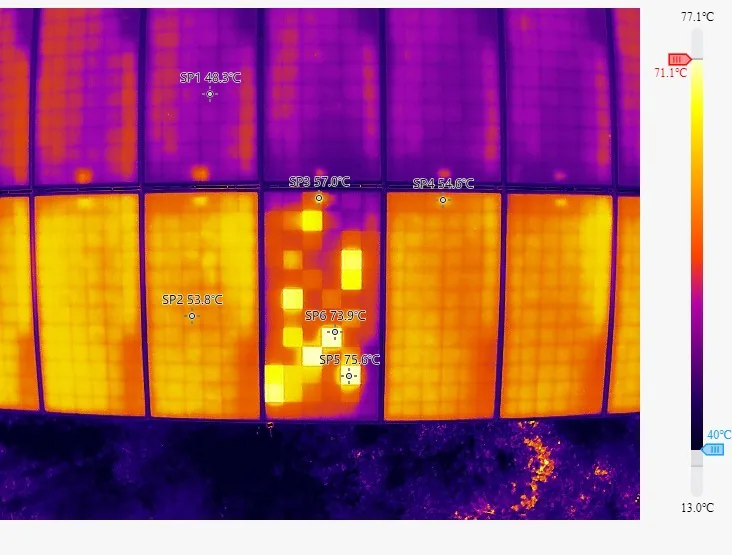 Matriz
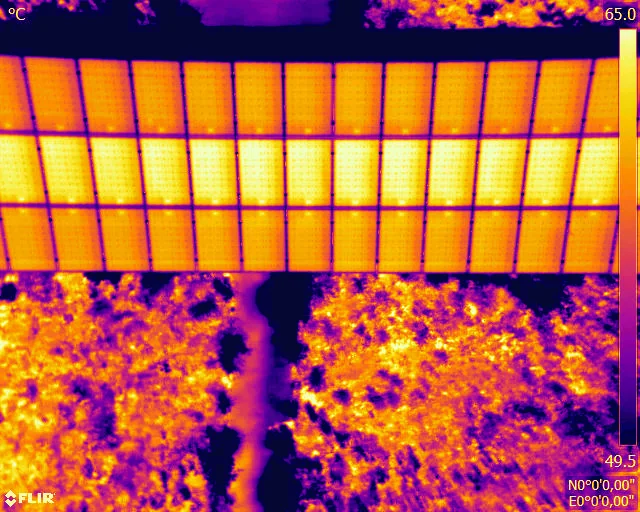 Fila
Significantly hotter than adjacent modules: loose terminal, defective diode, or compromised potting.
Gradient thermal anomaly on modules near the negative terminal: potential PID degradation.
Potential EVA encapsulant browning and thermal dissipation fatigue.
Other complex patterns are catalogued and earmarked for complementary electrical or electroluminescence testing.
Module operates within expected thermal thresholds. Monitored during the next annual pass.
Investigate root cause and execute scheduled corrective maintenance within a reasonable timeframe.
Risk of arc flash or fire hazard. Immediately isolate string and replace affected hardware.
| Included deliverables | Simplified | Detailed |
|---|---|---|
| Anomaly mapping on plant CAD/orthomosaic | Yes | Yes |
| Radiometric review over original thermal capture | Yes | Yes |
| Thermal and RGB image crops referencing source files | Yes | Yes |
| CoA classification | By anomaly pattern | Calibrated to measured temperature |
| Normalized ΔT temperature rise at 1,000 W/m² | — | Yes |
| Documented parameters: emissivity, distance, humidity | — | Yes |
| Full raw radiometric dataset attached | — | Yes |
| Primary operational use | General plant condition & O&M planning | Manufacturer warranty claims & M&A due diligence |
Because raw airborne data is identical, a simplified inspection can be upgraded to detailed later for targeted strings without mobilizing crews again.
Tier 1 manufacturers reject uncalibrated drone surveys. The detailed tier provides exact radiometric readings under standard test conditions, forming an ironclad warranty claim.
Signed by a certified Level 2 thermographer with comprehensive statistical charts by inverter, block, and string.
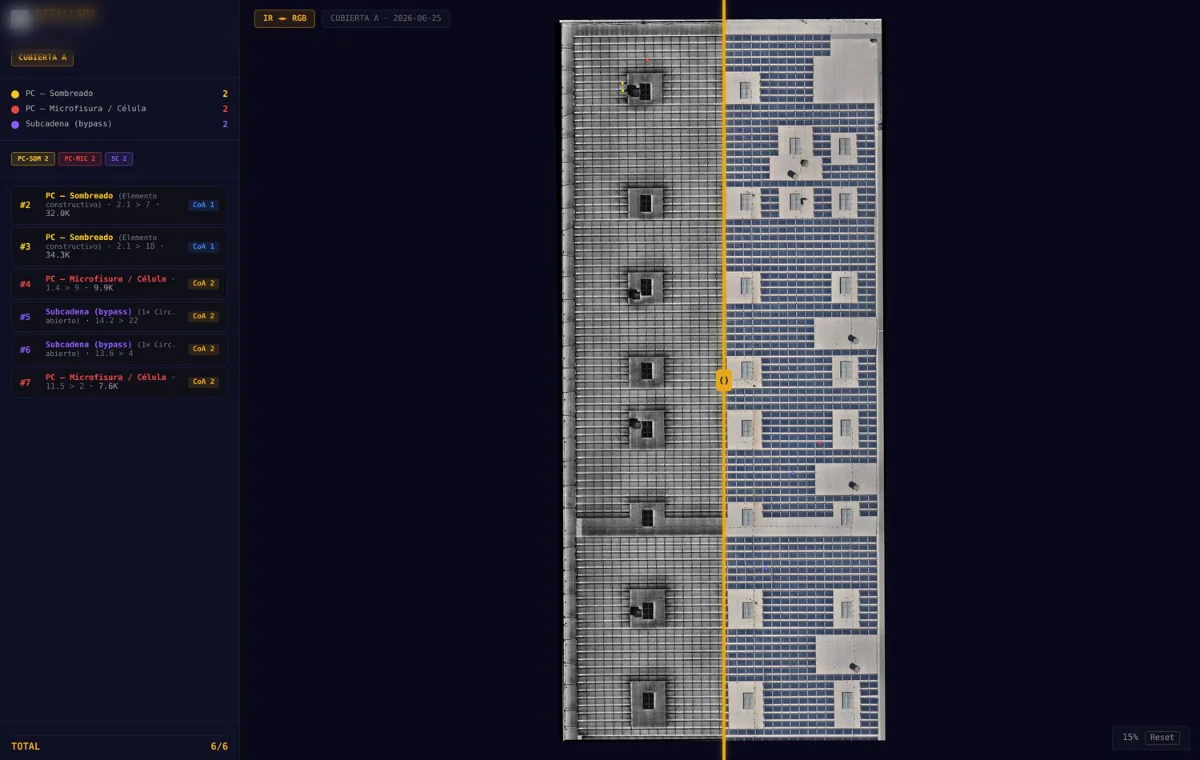
A single standalone browser file with zero software installation required. Features an interactive thermal-to-RGB sliding curtain.
Complete anomaly database with coordinates and metadata, formatted for immediate import into your CMMS / GMAO.
Every single anomaly is pinpointed on your plant map; when single-line diagrams are provided, tracking maps down to inverter, combiner, and string. Each entry includes thermal and visible images and recommended corrective action.
Turnaround time is confirmed in each technical proposal based on plant capacity (MW), calculated from image reception.
Download inspection client dossier (PDF)Flight inspection requirements (PDF)
Module count, capacity (MWp), location, and single-line diagram if available.
Forecast monitoring to ensure flight conditions meet IEC standards.
Conducted while the solar asset operates under maximum solar generation.
Level 2 thermographer analysis, interactive web visor, and CSV delivery.

DJI Matrice 4T equipped with 640×512 radiometric thermal sensor and high-resolution RGB camera. Ground resolution around 2 cm per pixel at flight elevation, exceeding IEC standards.
The orthomosaic serves only as a spatial navigation map. Diagnostics are conducted image-by-image on uncompressed radiometric thermograms, signed by a Level 2 certified thermographer.
IEC standards stipulate clean or low-soiled modules for conclusive inspection. Thermography conducted after specialized robotic washing eliminates false positive thermal signatures from bird droppings and dirt.
Pinpoint underperforming tables and quantifiably assess generation degradation without walking miles of arrays.
Accurate mapping down to inverter and string level, with ready-to-use CSV records for maintenance teams.
Validate technical health during asset transactions with independent reports signed by certified Level 2 personnel.
Inspect rooftop PV systems without scaffolding, work-at-height hazards, or stepping on modules.
Fully compliant airspace authorization with analysis validated by certified professionals.
Conducted during live operations while the facility injects maximum power into the grid.
Executive PDF audit report, browser-based interactive web viewer, and raw CSV dataset.
Rapid deployment across commercial portfolios and utility-scale solar farms throughout Iberia.
Evaluate the financial impact of common thermal cell and string anomalies across your annual production.
No. On the contrary: the facility must be fully operational and under active load, as thermal anomalies only manifest when modules are actively conducting current.
Site access and a designated point of contact on inspection day. If available, layout maps and single-line diagrams facilitate string mapping.
Flight dates are rescheduled at no cancellation penalty. Standard IEC inspections require minimum 600 W/m² irradiance to remain valid.
Yes. The detailed inspection tier provides radiometric measurements under strict standard conditions, offering the highest empirical credibility for replacement claims.
The detailed tier measures the calibrated absolute temperature of every hotspot and calculates the normalized temperature delta (ΔT).
They represent IEC abnormality classes: CoA 1 (minor/monitoring), CoA 2 (moderate defect requiring scheduled repair), and CoA 3 (critical safety/fire hazard requiring immediate isolation).
No. The interactive plant visor is a standalone HTML document that opens directly in any standard desktop browser.
Yes. We maintain operational crews in Porto, Barcelona, Madrid, and Seville, delivering turnkey coverage across the entire Iberian Peninsula.
Share your module count and site location. We provide an itemized fixed proposal in less than 24 hours.
Phone +34 936 555 555 · WhatsApp +34 623 984 040
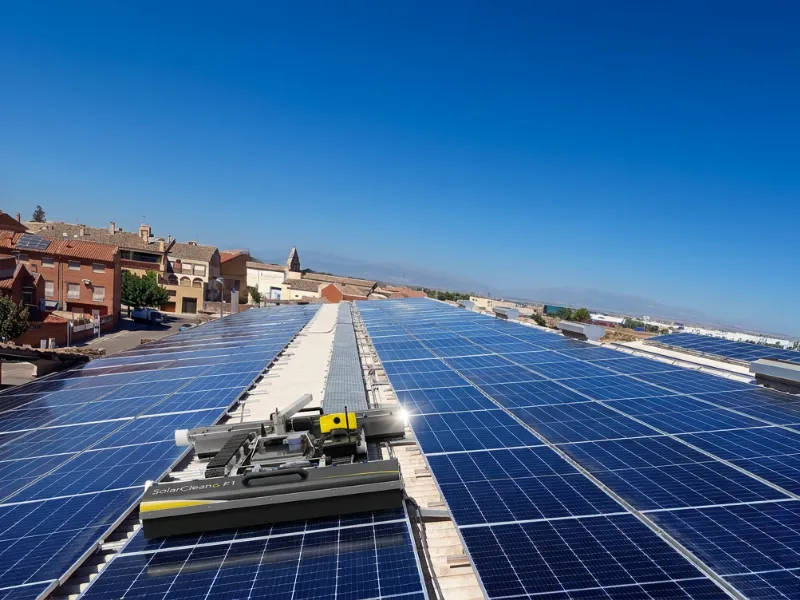
SolarCleano robotic systems and proprietary pure RO water.
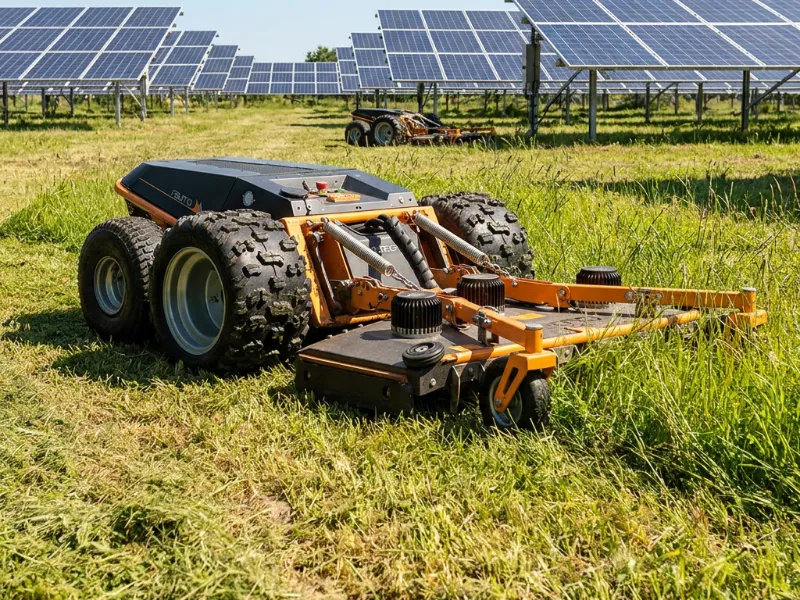
51 cm low-profile machine navigating under tables, zero herbicides.
Hot spots and defective cells with detailed radiometric report.
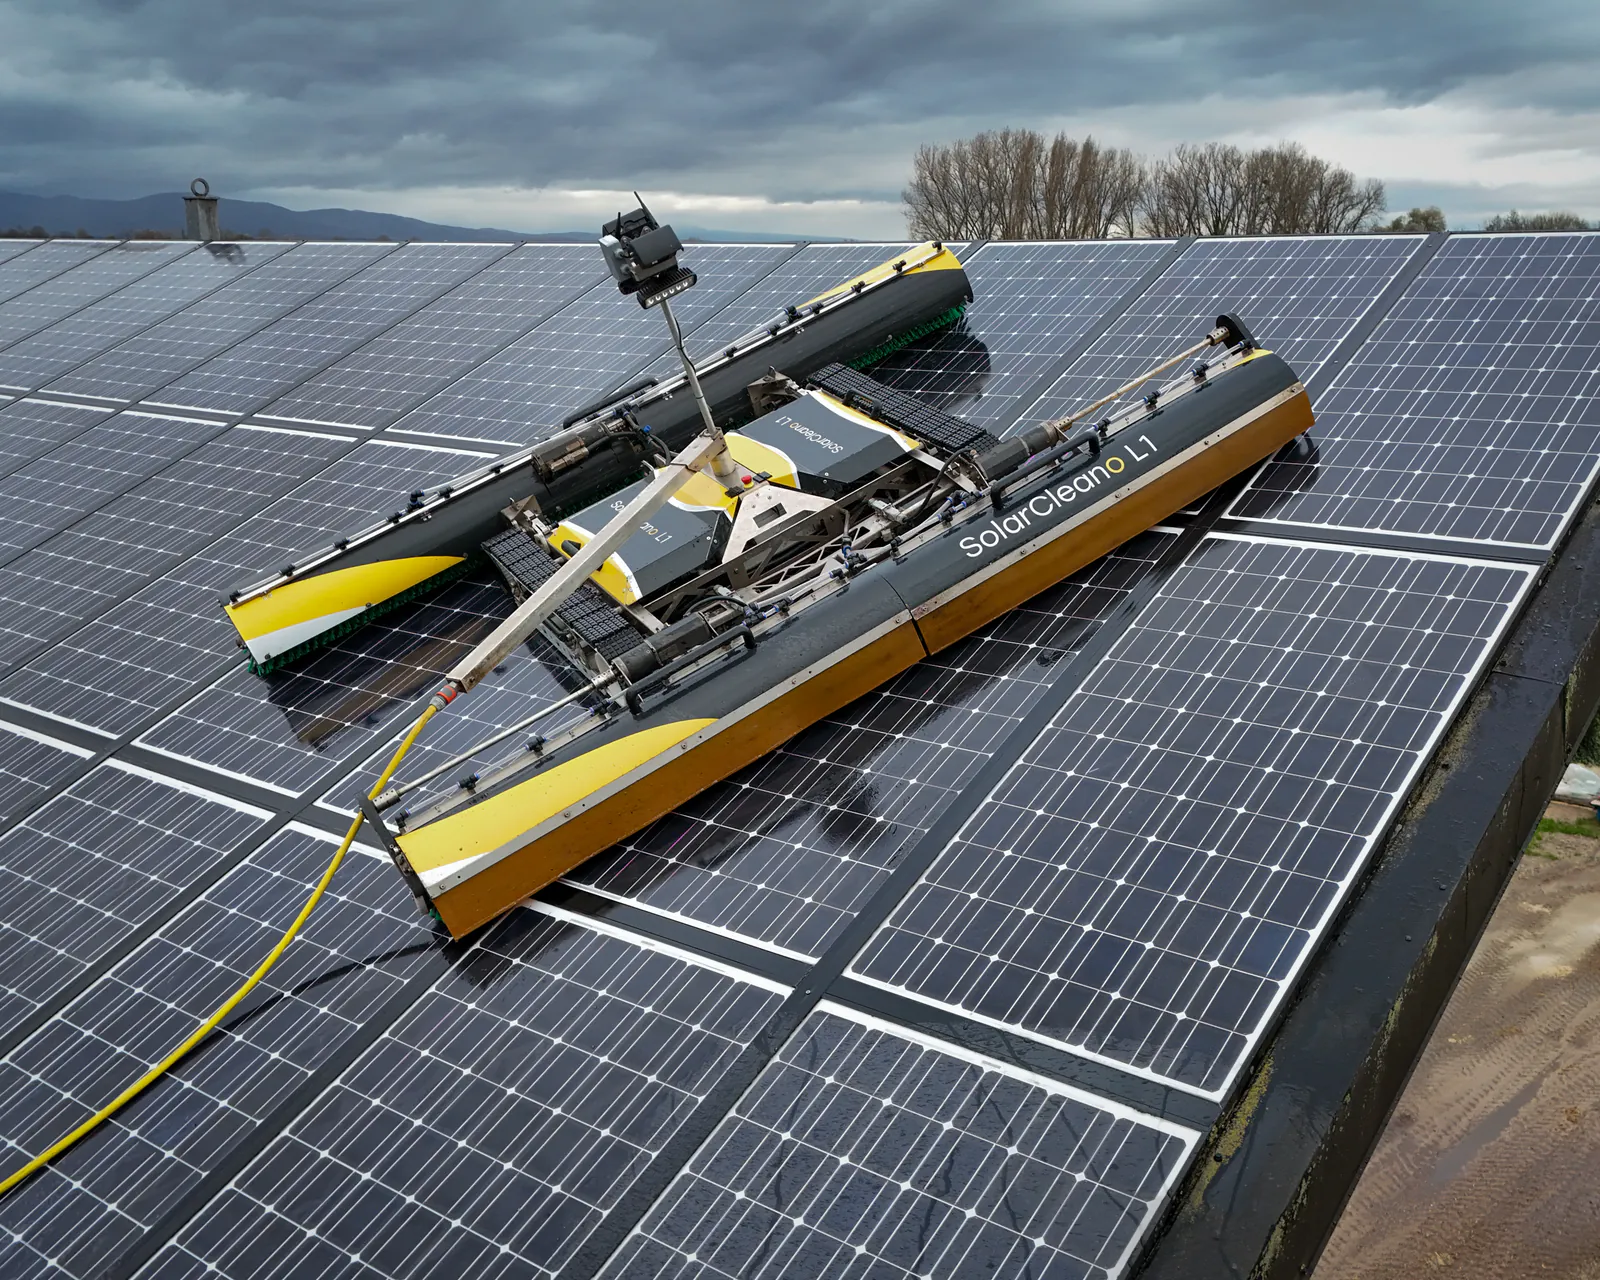
Official distributor in Iberia. Factory pricing and specs.